library(tidyverse)
library(tidymodels)
library(palmerpenguins)
library(knitr)

# add other packages as neededLab 06: Large Palmer Penguins
Logistic regression intro
Important
Due:
- Friday, November 03 , 11:59pm (Tuesday labs)
- Sunday, November 05, 11:59pm (Thursday labs)
Introduction
In this assignment, you’ll get to put into practice the logistic regression skills you’ve developed to analyze data about Palmer Penguins. You will also practice handling merge conflicts.
Learning goals
By the end of the lab you will be able to
- conduct exploratory data analysis for logistic regression
- fit logistic regression models and write the regression equation
- use the model to calculate predicted probabilities
- continue developing a collaborative workflow with your teammates
- develop strategies for dealing with merge conflicts
Merge Conflicts (uh oh)
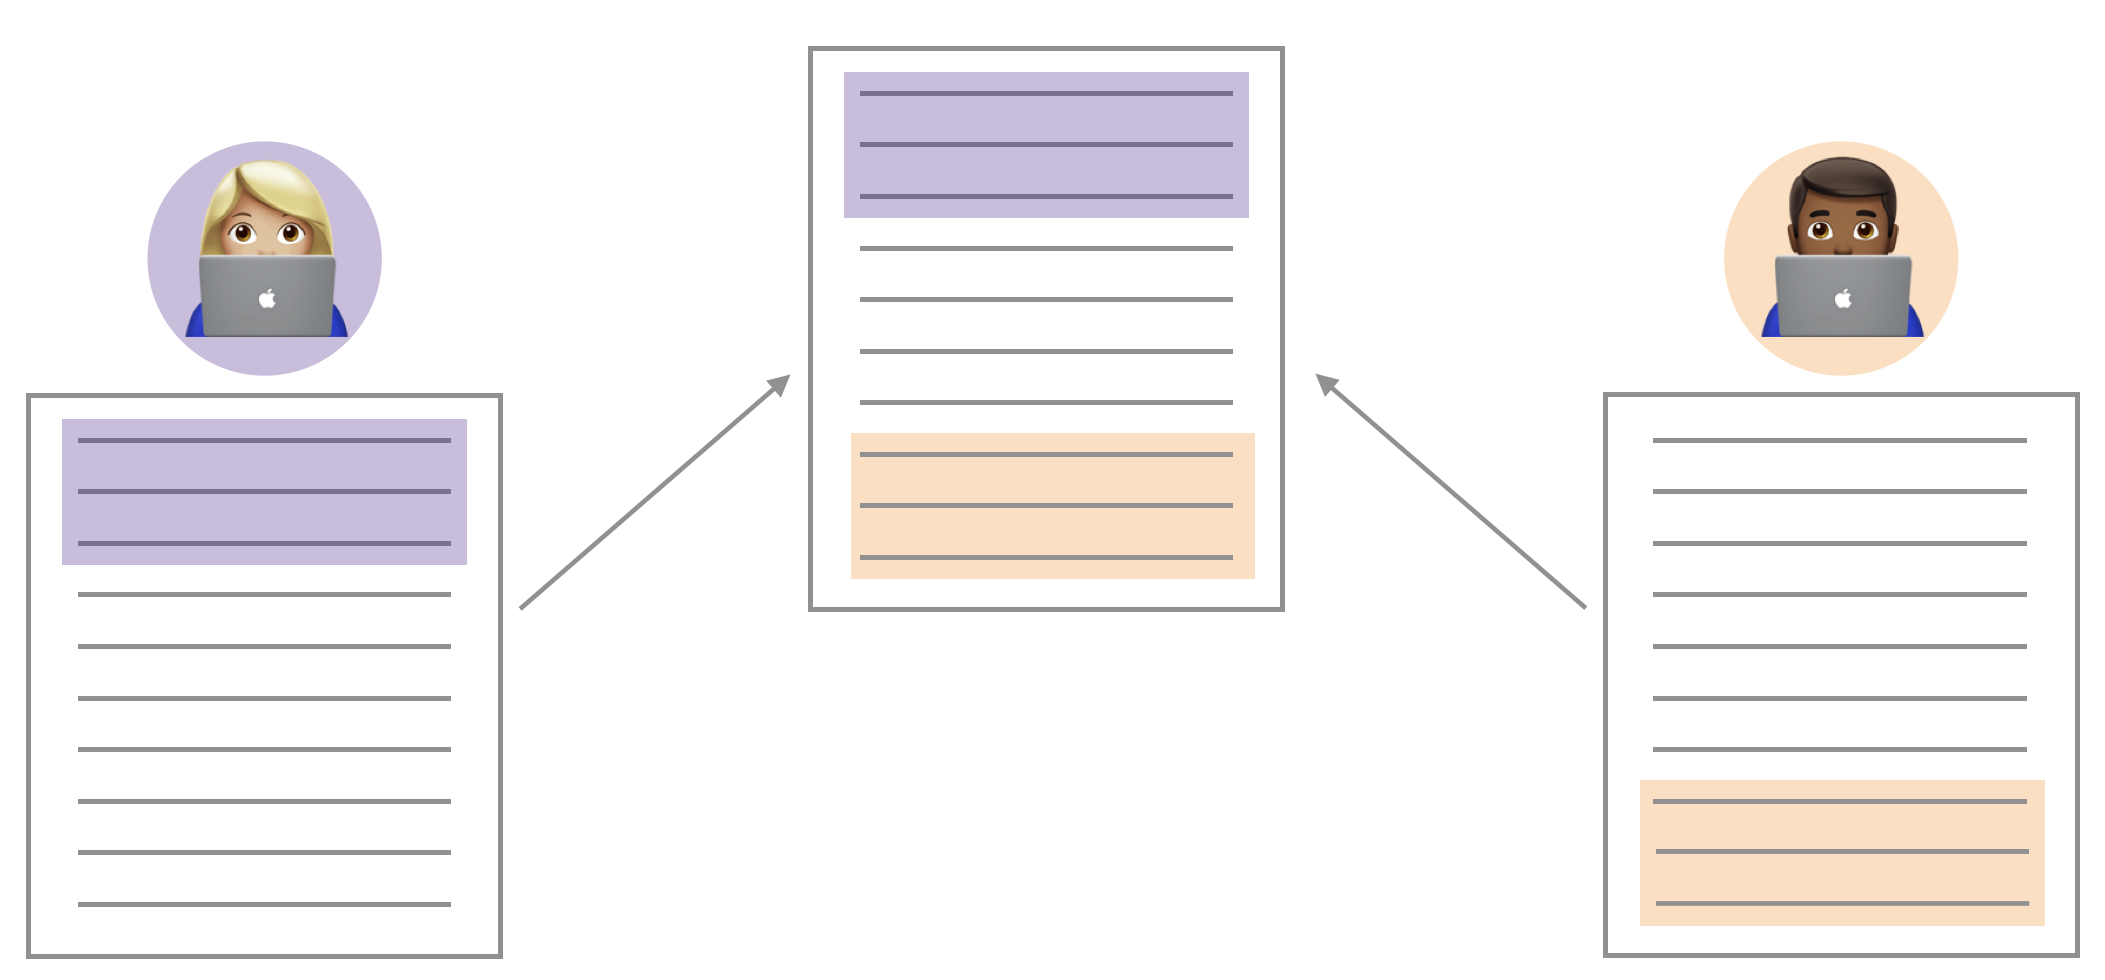
You may have seen something like the image above through the course of your collaboration. When two collaborators make changes to a file and push the file to their repository, git merges these two files.
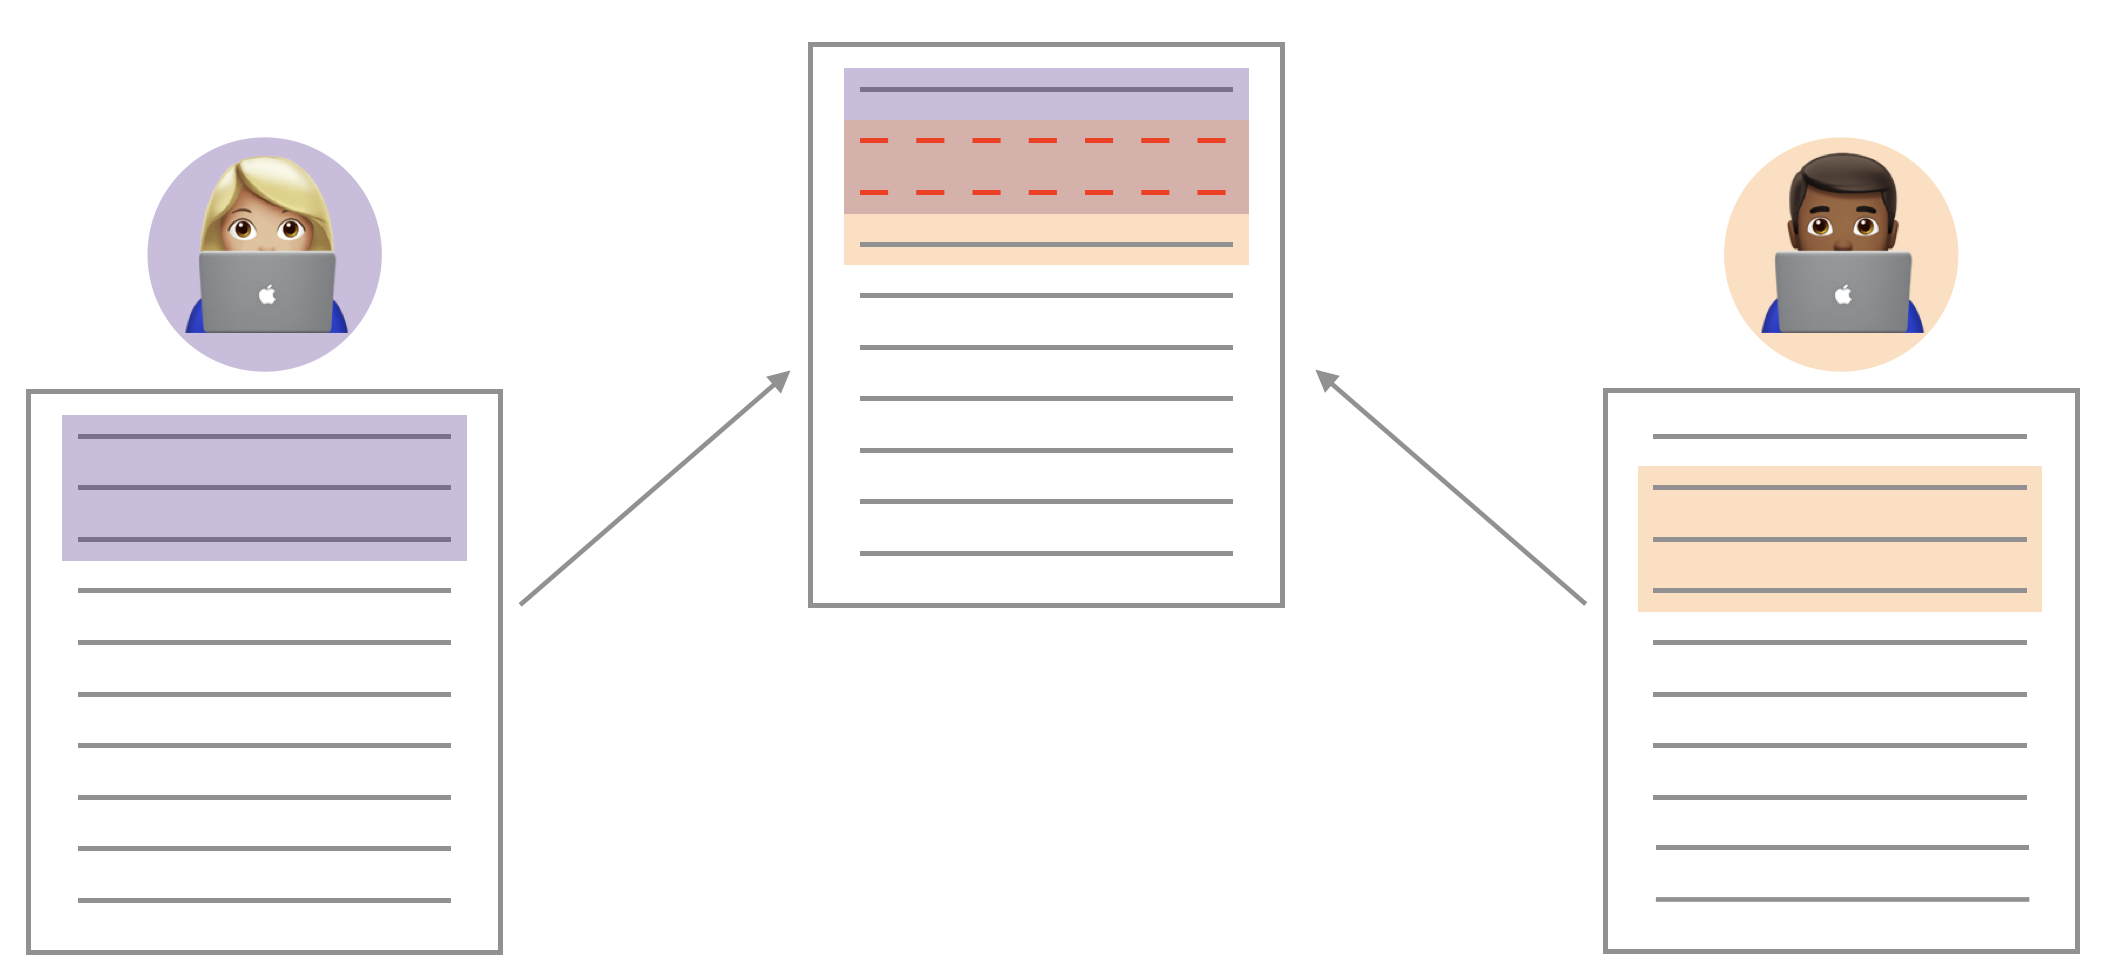
If these two files have conflicting content on the same line, git will produce a merge conflict. Merge conflicts need to be resolved manually, as they require a human intervention:
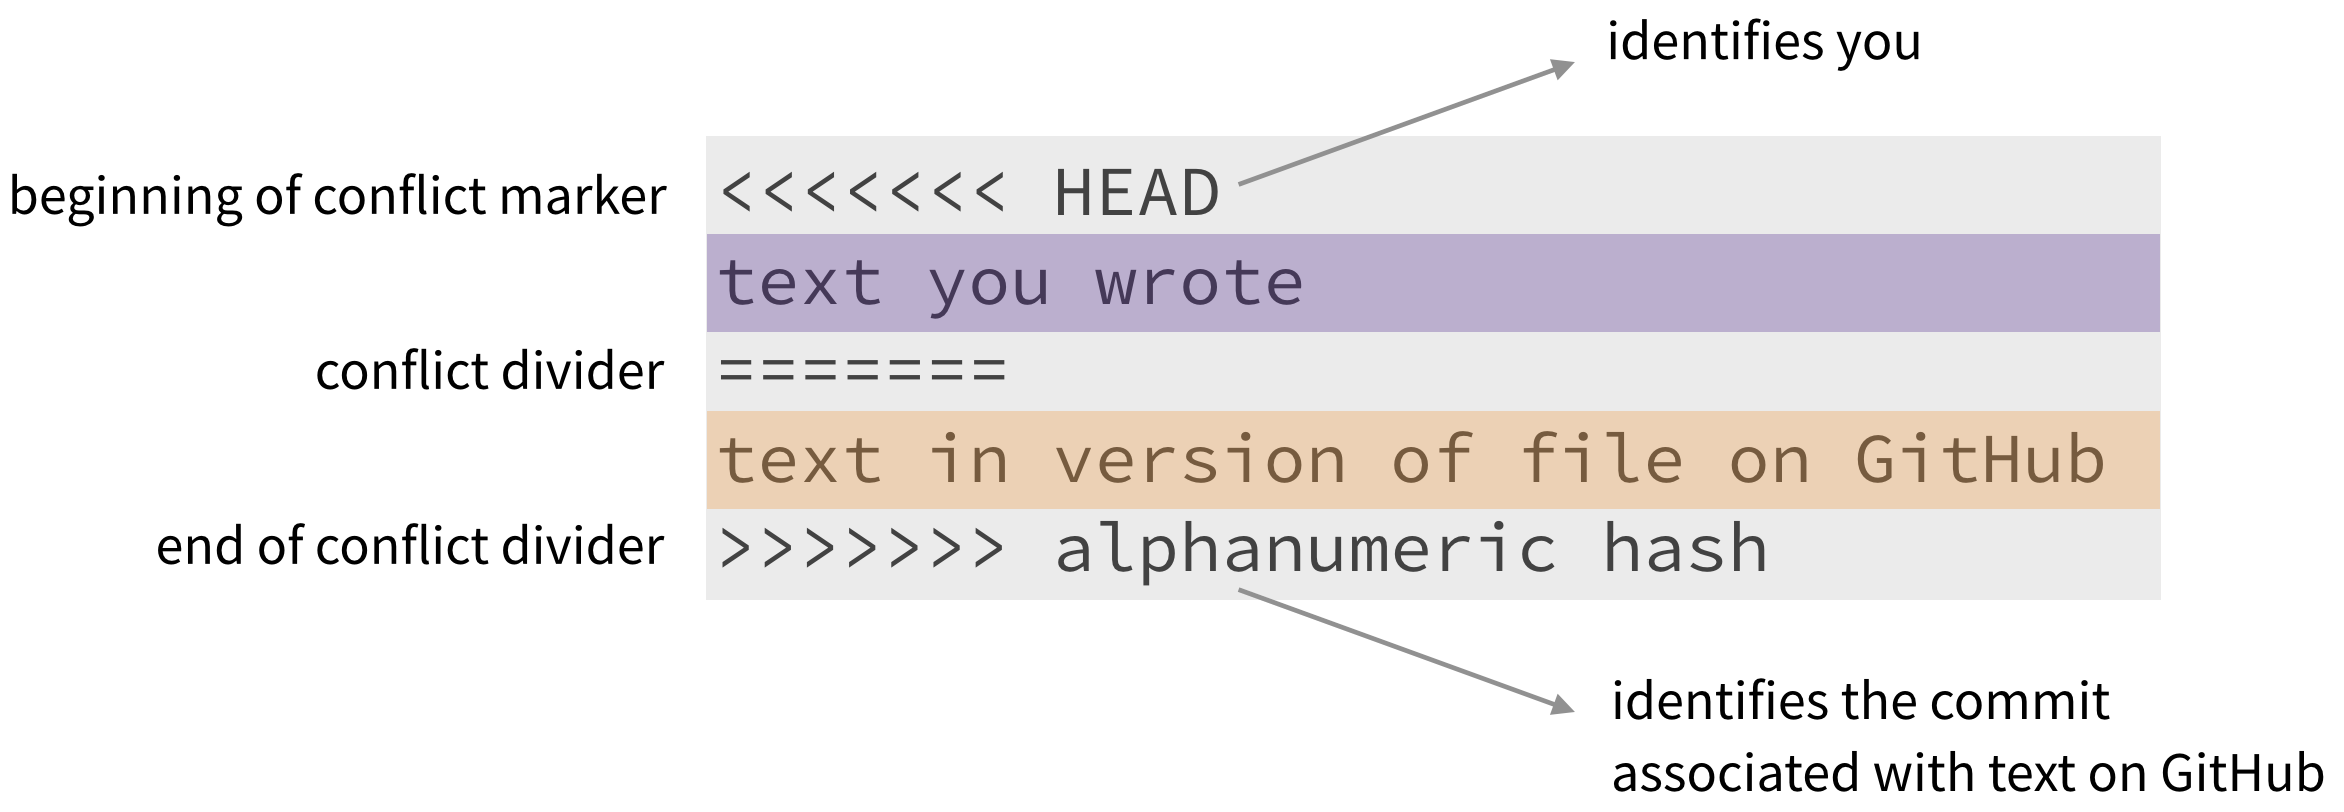
To resolve the merge conflict, decide if you want to keep only your text, the text on GitHub, or incorporate changes from both texts. Delete the conflict markers <<<<<<<, =======, >>>>>>> and make the changes you want in the final merge.
Assign numbers 1, 2, 3, and 4 to each of your team members (if only 3 team members, just number 1 through 3). Go through the following steps in detail, which simulate a merge conflict. Completing this exercise will be part of the lab grade.
Resolving a merge conflict
Step 1: Everyone clone the merge-conflict assignment repo in RStudio and open file merge-conflict.Rmd.
Member 4 should look at the group’s repo on GitHub.com to ensure that the other members’ files are pushed to GitHub after every step.
Step 2: Member 1 Change the team name to your team name. Render, commit, and push.
Step 3: Member 2 Change the team name to something different (i.e., not your team name). Render, commit, and push.
You should get an error.
Pull and review the document with the merge conflict. Read the error to your teammates. You can also show them the error by sharing your screen. A merge conflict occurred because you edited the same part of the document as Member 1. Resolve the conflict with whichever name you want to keep, then render, commit and push again.
Step 4: Member 3 Write some narrative in the space provided. You should get an error.
This time, no merge conflicts should occur, since you edited a different part of the document from Members 1 and 2. Read the error to your teammates. You can also show them the error by sharing your screen.
Click to pull. Then render, commit, and push.
Please ask your TA if you have any questions about merge conflicts and collaborating in GitHub.
Getting started
A repository has already been created for you and your teammates. Everyone in your team has access to the same repo.
Go to the sta210-fa23 organization on GitHub. Click on the repo with the prefix lab-05. It contains the starter documents you need to complete the lab.
Each person on the team should clone the repository and open a new project in RStudio. Throughout the lab, each person should get a chance to make commits and push to the repo.
Do not make any changes to the
.qmdfile until the instructions tell you do to so.
Workflow: Using Git and GitHub as a team
Important
There are no Team Member markers in this lab; however, you should use a similar workflow as in Lab 04. Only one person should type in the group’s .qmd file at a time. Once that person has finished typing the group’s responses, they should render, commit, and push the changes to GitHub. All other teammates can pull to see the updates in RStudio.
Every teammate must have at least one commit in the lab. Everyone is expected to contribute to discussion even when they are not typing.
Packages
The following packages are used in the lab.
Data: Palmer Penguins
We will go back to the Palmer penguins data used in HW 02.
Data were collected and made available by Dr. Kristen Gorman and the Palmer Station, Antarctica LTER, a member of the Long Term Ecological Research Network. (Gorman, Williams, and Fraser 2014)
These data can be found in the palmerpenguins package. We’re going to be working with the penguins dataset from this package. The dataset contains data for 344 penguins. There are 3 different species of penguins in this dataset, collected from 3 islands in the Palmer Archipelago, Antarctica. Click here to see the codebook.
We will focus on the following variables:
| variable | class | description |
|---|---|---|
species |
integer | Penguin species (Adelie, Gentoo, Chinstrap) |
body_mass_g |
integer | Body mass in g |
flipper_length_mm |
integer | Flipper length in mm |
Exercises
The goal of this analysis is to use logistic regression to understand the relationship between flipper length, island, and whether a penguin is considered large. Let’s assume a penguin is considered large if it has an above average body mass. First, remove missing values and create a new response variable to identify whether a penguin is large.
penguins <- penguins |>
  drop_na() |>
  mutate(large = factor(if_else(body_mass_g > mean(body_mass_g, na.rm = TRUE), 1, 0)))
And let’s make sure the new variable looks how we would expect before we continue with the analysis. Note the mean body mass for the penguins in the data is 4207.057 grams.
penguins |>
  group_by(large) |>
  summarise(min = min(body_mass_g), mean = mean(body_mass_g), max = max(body_mass_g))
# A tibble: 2 × 4
large min mean max
<fct> <int> <dbl> <int>
1 0 2700 3605. 4200
2 1 4250 4988. 6300Exercise 1
Let’s start by examining the relationship between large and species.
Visualize the relationship between large and species. Write something you observe about the relationship between these two variables based on the plot.
Exercise 2
Calculate the probability a randomly selected penguin is large, given that it is from the Adelie species.
Calculate the odds a randomly selected penguin is large, given it is from the Adelie speices.
Exercise 3
Split the data into a 75% training set, penguins_train, and 25% test set, penguins_test. Use a seed of 29. We will be using the training set throughout the assignment for modeling and the test set to assess the performance.
Exercise 4
You want to fit a model using species to predict the odds a penguins is large. Let \(\pi\) be the probability a penguin is large. The model has the form shown below.
\[ \log\Big(\frac{\pi}{1-\pi}\Big) = \beta_0 + \beta_1~ Chinstrap + \beta_2 ~ Gentoo \]
- Fit the model using the training data and neatly display the model output using three digits.
- What are the predicted odds of a penguin being large if it is Gentoo?
- What are the predicted odds of a penguin being large if it is Adelie?
Exercise 5
Next, we’d like to add flipper length to the model. We’ll start by examining the relationship between these two variables.
Visualize the relationship between
flipper_length_mmandlarge. What is something you observe about the relationship between these two variables from the plot?Add flipper length to the model from Exercise 4 so that there are two predictors,
speciesandflipper_length_mm. Neatly display the model output using three digits.Write the estimated regression equation.
Exercise 6
Use the model from Exercise 5.
How do you expect the log-odds of being a large penguin to change when going from a penguin with flipper length 185 mm to a penguin with flipper length 200 mm? Assume both penguins are of the Gentoo species.
How do you expect the odds of being a large penguin to change when going from a penguin with flipper length 185 mm to a penguin with flipper length 200 mm? Assume both penguins are of the Gentoo species.
Exercise 7
Use the model from Exercise 5.
How do you expect the log-odds of being a large penguin to change when going from a penguin with flipper length 195 mm recorded as Chinstrap to a penguin with flipper length 210 mm recorded as Adelie?
How do you expect the odds of being a large penguin to change when going from a penguin with flipper length 195 mm recorded as Chinstrap to a penguin with flipper length 210 mm recorded as Adelie?
Exercise 8
Now let’s assess the performance of both models on the test set.
Use
predict()function to get the predicted class for the observations in thepenguins_testbased on the model from Exercise 4. Calculate the percentage of observations that were mislcassified.Use the
predict()function to get the predicted class for the observations inpenguins_testbased on the model from Exercise 5. Calculate the percentage of observations that were mislcassified.Based on this analysis, which model would you select? Briefly explain.
Submission
Warning
Before you wrap up the assignment, make sure all documents are updated on your GitHub repo. We will be checking these to make sure you have been practicing how to commit and push changes.
Remember – you must turn in a PDF file to the Gradescope page before the submission deadline for full credit.
One team member submit the assignment:
- Go to http://www.gradescope.com and log in using your NetID credentials.
- Click on your STA 210 course.
- Click on the assignment, and you’ll be prompted to submit it.
- Select all team members’ names, so they receive credit on the assignment. Click here for video on adding team members to assignment on Gradescope.
- Mark the pages associated with each exercise. All of the pages of your lab should be associated with at least one question (i.e., should be “checked”).
- Select the first page of your PDF submission to be associated with the “Workflow & formatting” section.
Grading
Total points available: 50 points.
| Component | Points |
|---|---|
| Ex 1 - 8 | 40 |
| Workflow & formatting | 51 |
| Complete merge conflict activity | 5 |
References
Gorman, Kristen B., Tony D. Williams, and William R. Fraser. 2014. “Ecological Sexual Dimorphism and Environmental Variability Within a Community of Antarctic Penguins (Genus Pygoscelis).” Edited by André Chiaradia. PLoS ONE 9 (3): e90081. https://doi.org/10.1371/journal.pone.0090081.
Footnotes
The “Workflow & formatting” grade is to assess the reproducible workflow and collaboration. This includes having at least one meaningful commit from each team member and updating the team name and date in the YAML.↩︎