library(tidyverse)
library(tidymodels)
library(knitr)

heart_disease <- read_csv("data/framingham.csv") |>
  select(totChol, TenYearCHD) |>
  drop_na() |>
  mutate(high_risk = as.factor(TenYearCHD)) |>
select(totChol, high_risk)AE 12: Logistic regression introduction
Important
Go to the course GitHub organization and locate your ae-12 repo to get started.
Render, commit, and push your responses to GitHub by the end of class. The responses are due in your GitHub repo no later than Thursday, November 2 at 11:59pm.
Packages
Data: Framingham study
This data set is from an ongoing cardiovascular study on residents of the town of Framingham, Massachusetts. We want to use the total cholesterol to predict if a randomly selected adult is high risk for heart disease in the next 10 years.
high_risk:- 1: High risk of having heart disease in next 10 years
- 0: Not high risk of having heart disease in next 10 years
totChol: total cholesterol (mg/dL)
Outcome: high_risk
ggplot(data = heart_disease, aes(x = high_risk)) +
  geom_bar() +
  scale_x_discrete(labels = c("1" = "High risk", "0" = "Low risk")) +
  labs(
    title = "Distribution of 10-year risk of heart disease",
    x = NULL)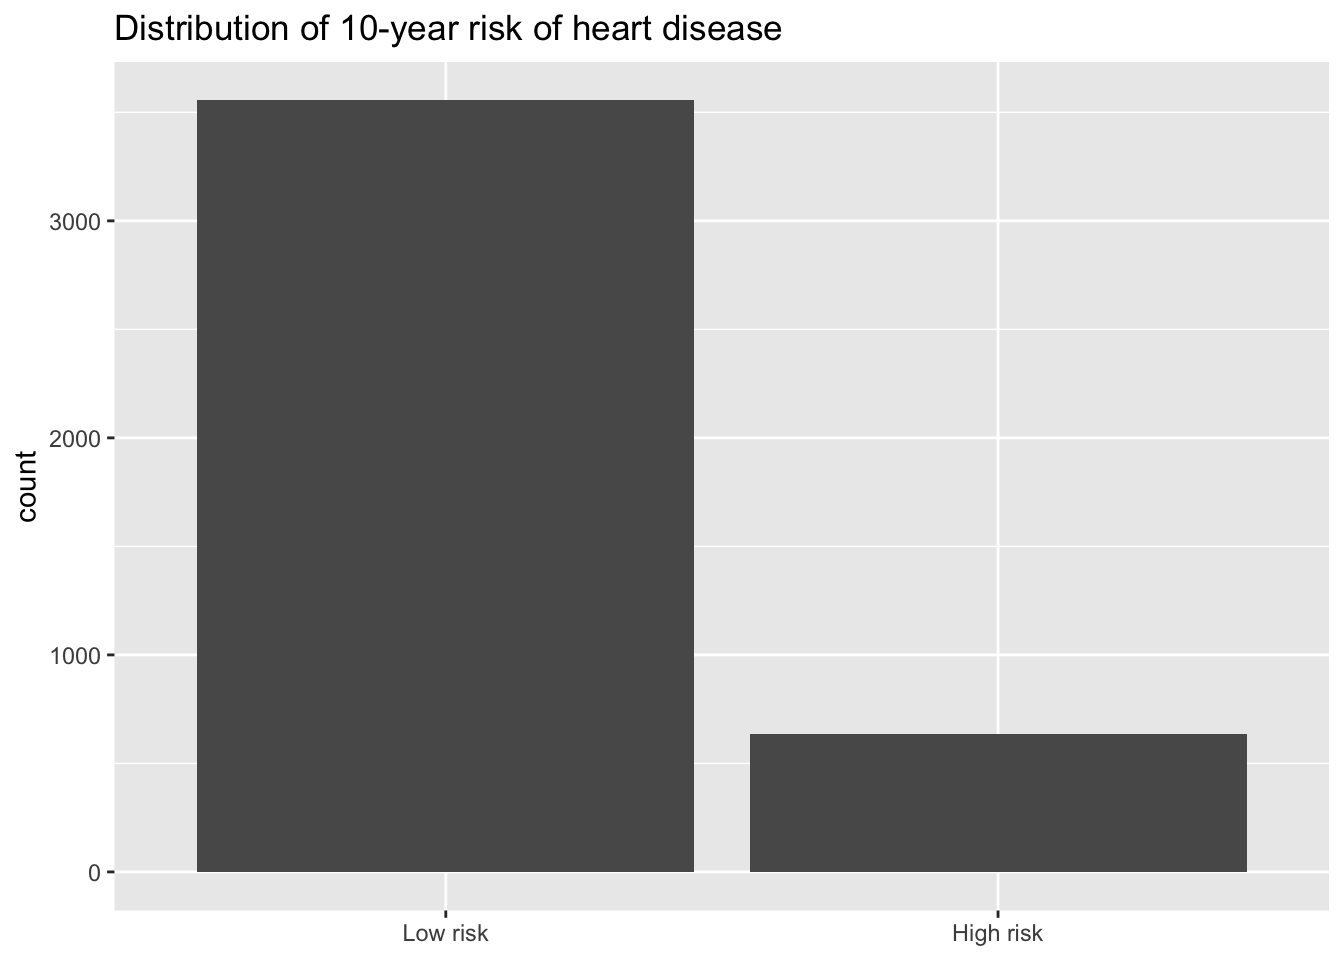
heart_disease |>
  count(high_risk)
# A tibble: 2 × 2
high_risk n
<fct> <int>
1 0 3555
2 1 635Calculating probability and odds
What is the probability a randomly selected person in the study is not high risk for heart disease in the next 10 years?
What are the odds a randomly selected person in the study is not high risk for heart disease in the next 10 years?
Logistic regression model
Fit a logistic regression model to understand the relationship between total cholesterol and risk for heart disease.
Let \(\pi\) be the probability an adult is high risk of heart disease. The statistical model is
\[\log\Big(\frac{\pi_i}{1-\pi_i}\Big) = \beta_0 + \beta_1 TotChol_i\]
heart_disease_fit <- logistic_reg() |>
  set_engine("glm") |>
  fit(high_risk ~ totChol, data = heart_disease, family = "binomial")

tidy(heart_disease_fit) |> kable(digits = 3)| term | estimate | std.error | statistic | p.value |
|---|---|---|---|---|
| (Intercept) | -2.894 | 0.230 | -12.607 | 0 |
| totChol | 0.005 | 0.001 | 5.268 | 0 |
- Write the regression equation. Round to 3 digits.
Calculating log-odds, odds and probabilities
Based on the model, if a randomly selected person has a total cholesterol of 250 mg/dL,
What are the log-odds they are high risk for heart disease in the next 10 years?
What are the odds they are high risk for heart disease in the next 10 years?
What is the probability they are high risk for heart disease in the next 10 years? Use the odds to calculate your answer.
Comparing observations
Suppose a person’s cholesterol changes from 250 mg/dL to 200 mg/dL.
How do you expect the log-odds that this person is high risk for heart disease in the next 10 years to change?
How do you expect the odds that this person is high risk for heart disease in the next 10 years to change?
Submission
Important
To submit the AE:
- Render the document to produce the PDF with all of your work from today’s class.
- Push all your work to your
ae-12repo on GitHub. (You do not submit AEs on Gradescope).