Lab 02

Bootstrap confidence interval for the slope

Sep 12 & 14, 2023

Reminders

  • Select the pages corresponding to each exercise when you when you submit the assignment on Gradescope.

    • Click here for written and video instructions on submitting an assignment and marking pages on Gradescope.
  • In your write up:

    • Write all narrative in complete sentences.

    • Include an informative title and axis labels on graphs.

    • Write responses in the context of the data.

    • Describe distribution using shape, center, spread, and potential outliers. Describe relationships between variables using strength, direction, and shape.

Axis labels and titles

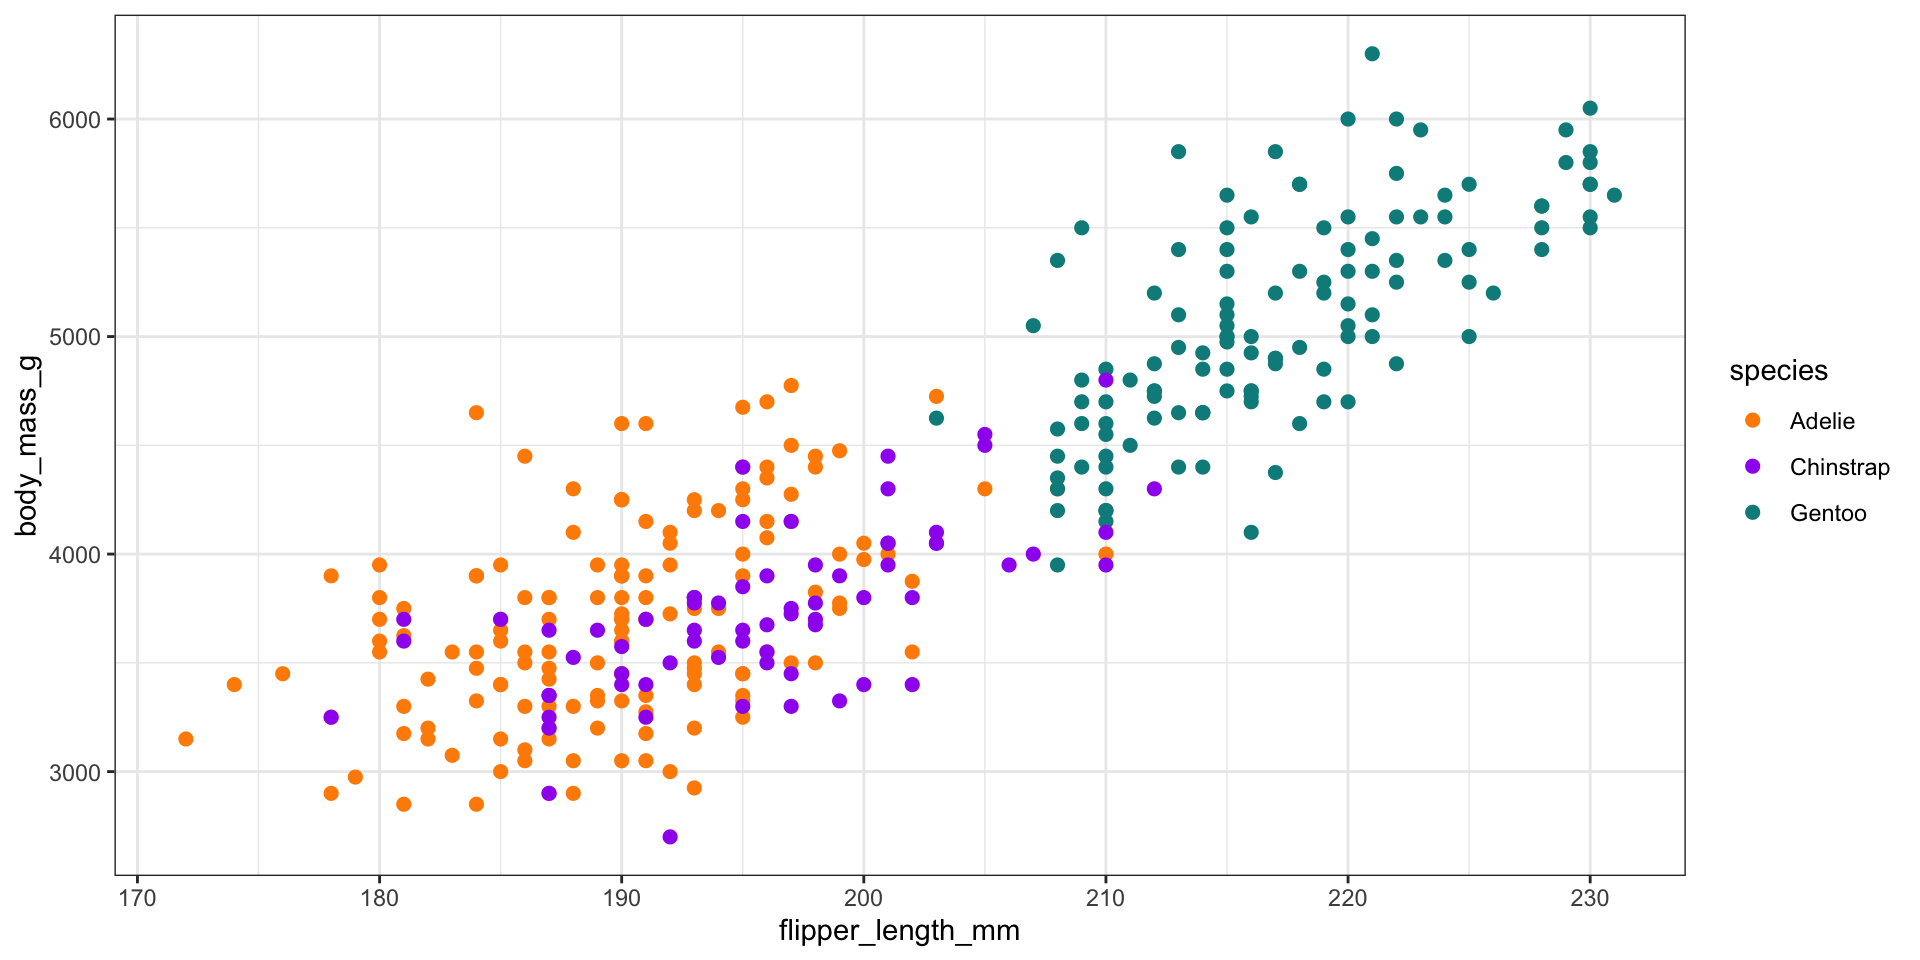
Below is a graph of association between flipper length in millimeters and body mass in grams of three species of penguins in Palmer Station, Antarctica. What are informative title and axis labels for this graph?

Code style

Which code chunk would you rather read?

# code chunk 1
penguins|>filter(!is.na(flipper_length_mm))|>group_by(species)|>summarise(min=min(flipper_length_mm),mean=mean(flipper_length_mm),sd=sd(flipper_length_mm),max=max(flipper_length_mm),n=n())


# code chunk 2
penguins |> 
  filter(!is.na(flipper_length_mm)) |> 
  group_by(species) |> 
  summarise(min = min(flipper_length_mm), 
            mean = mean(flipper_length_mm), 
            max = max(flipper_length_mm),
            n = n())

Code style cont’d

Make code easier to read and debug by

  • Putting each element on a different line (start a new line after + and |>)

  • Putting spaces before and after operators (+, -, *, =, |> )

  • In general, avoiding long lines of code, i.e. lines longer than 120 characters.

See the Tidyverse Style Guide for more tips on code styling.

Today’s lab

  • Remember to use a reproducible workflow with regular commits (and informative commit messages).

  • Push all updated files after each commit! The Git pane should be clear after each Render -> Commit -> Push.